 Photo by Debby Hudson on Unsplash
Evaluating the effectiveness of law schools is challenging for two reasons. The first hurdle lies in defining effectiveness. What does it mean for one law school to provide a better legal education than other schools? Generally, this centers on producing effective lawyers, although such a definition simply punts the definition of effectiveness up a level. Regardless, you cannot be an effective lawyer without actually becoming a licensed attorney. And to do this, you have to pass the bar exam. Thus, let’s make ‘preparing students to pass the bar exam’ one measure of law school effectiveness.
Now for the second hurdle. How do we measure whether a school effectively prepares students for the bar exam? This question is causal in nature. For example, let’s take a student deciding on which law school to attend. She knows she is going to take the 2023 North Carolina bar exam. In evaluating law school effectiveness, we want to know her probability of bar passage in NC, based solely on her pre-law school characteristics, given various law schools. These differences in probabilities between law schools shed light on each law school’s effectiveness in preparing students for the bar exam.
This post is my attempt to answer this question. I lay out the problems with my approach at the end, but the bottom line is that I’m not convinced that it’s possible to answer this question with current data sources. But, I’ll let readers be the final judge.
Overview of Method
As already stated, we want to know how well law schools prepare students for the bar exam. We’ll do this by predicting each school’s bar passage rate based on school-level bar passage predictors and then measure how well each school performs against its predicted passage rate. To account for student quality, we will incorporate the school’s median, 25th percentile, and 75th percentile undergraduate GPA and LSAT score of incoming students.
We’ll also account for first-year attrition. The reason is that schools typically flunk-out poor performing students and these students have a low probability of bar passage. Thus, the quickest way for a school to raise its bar passage rate is to kick out more low-performing students.
Exploration of LSAT, undergrad GPA, and attrition as predictors
AccessLex Institute aggregates the data law school data. We’ll use this data to find each school’s yearly median, 25th percentile, and 75th percentile undergraduate GPA and LSAT score of incoming students, attrition rate, and bar passage rate by state and year. Years in this post represent the year students took the bar exam. For admissions factors such as median undergrad GPA and LSAT this means that the years represent the median values for students who entered law school school three years prior to the stated year.
Relationship between bar passage and both undergraduate GPA and LSAT scores
Prior to modeling, however, we’ll examine the individual relationships between the predictors and bar passage. This will provide us initial confirmation that we should at least test them in models. Figure 1 shows the relationship between both median undergrad GPA (top plot) and median LSAT score (bottom plot) and bar passage. Each reveal a positive relationship between the admissions factor and bar passage.
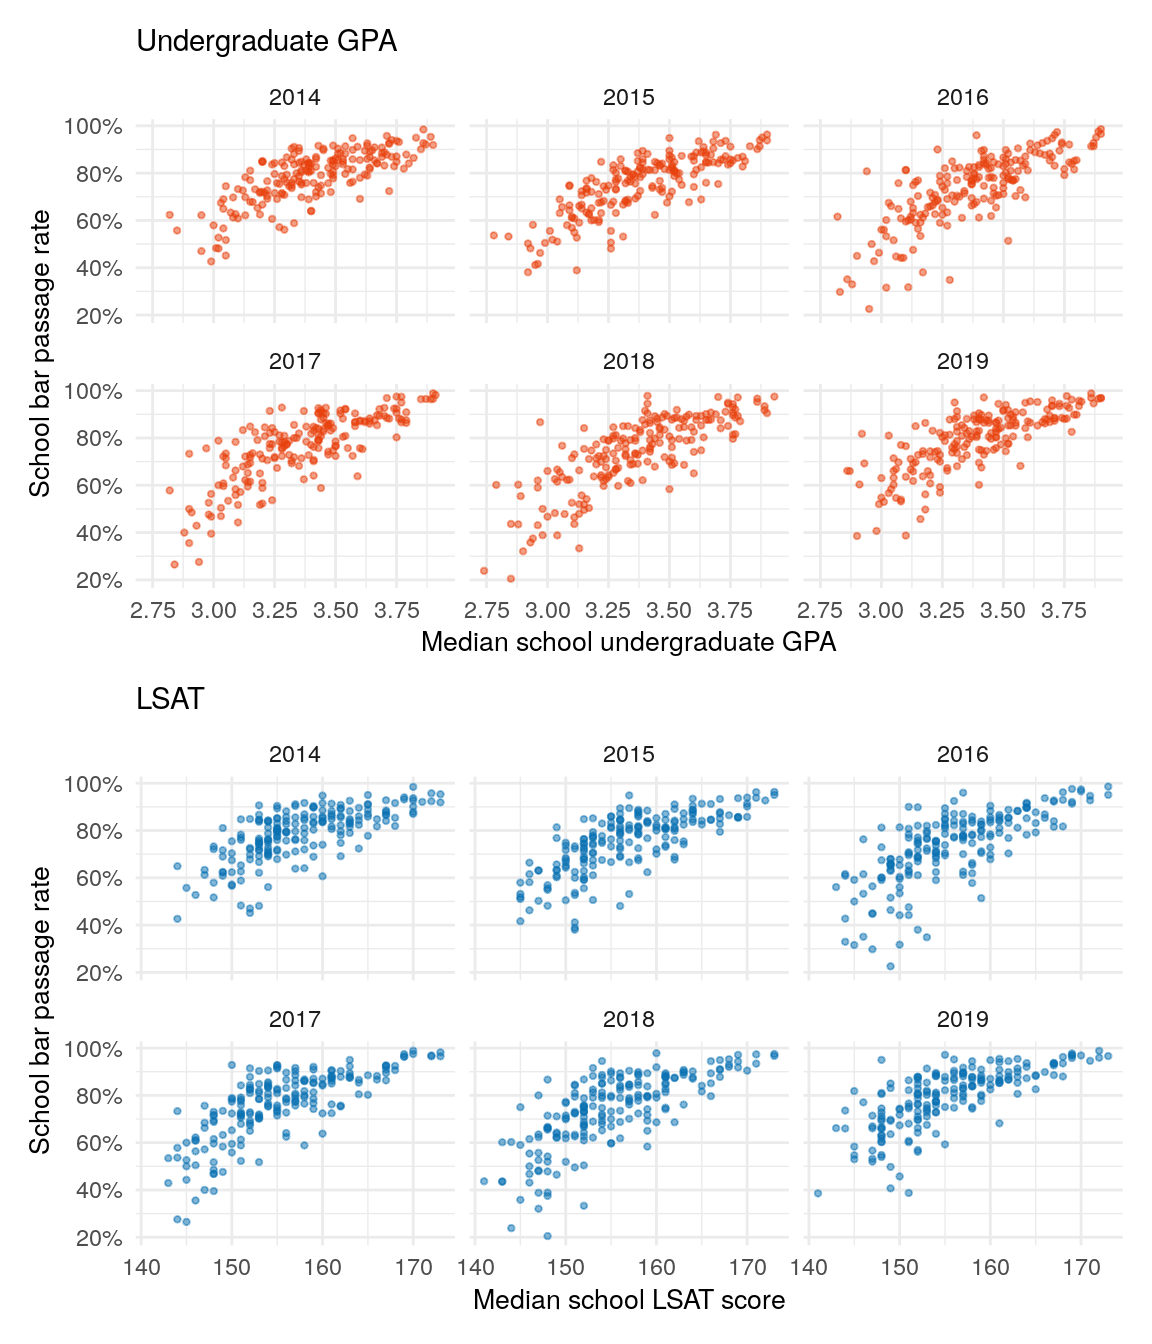
Figure 1: The top plot shows the relationship between a school’s median undergrad GPA and bar passage rate. The bottom plot highlights the relationship between median LSAT and bar passage. Both median undergrad GPA and median LSAT correlate with bar passage.
Correlation between median LSAT and median undergrad GPA
We’ll next look at the correlation between median undergrad GPA and median LSAT. Our prior is that these two predictors are highly correlated, as more elite schools have higher median undergrad GPAs and LSAT scores. This could cause colinearity problems within our models, which might widen the uncertainty of predictions.
Figure 2 confirms our prior: median undergrad GPA and median LSAT are highly correlated. In the plot, both predictors are standardized to have a mean of 0 and standard deviation of 1, allowing us to compare their linear relationship - the blue line - with a prefect correlation represented by a line with a slope of 1 - the red dashed line. The plot shows an extremely strong relationship between median undergrad GPA and median LSAT. The linear relationship is only slightly flatter than the perfect relationship (red dashed line).
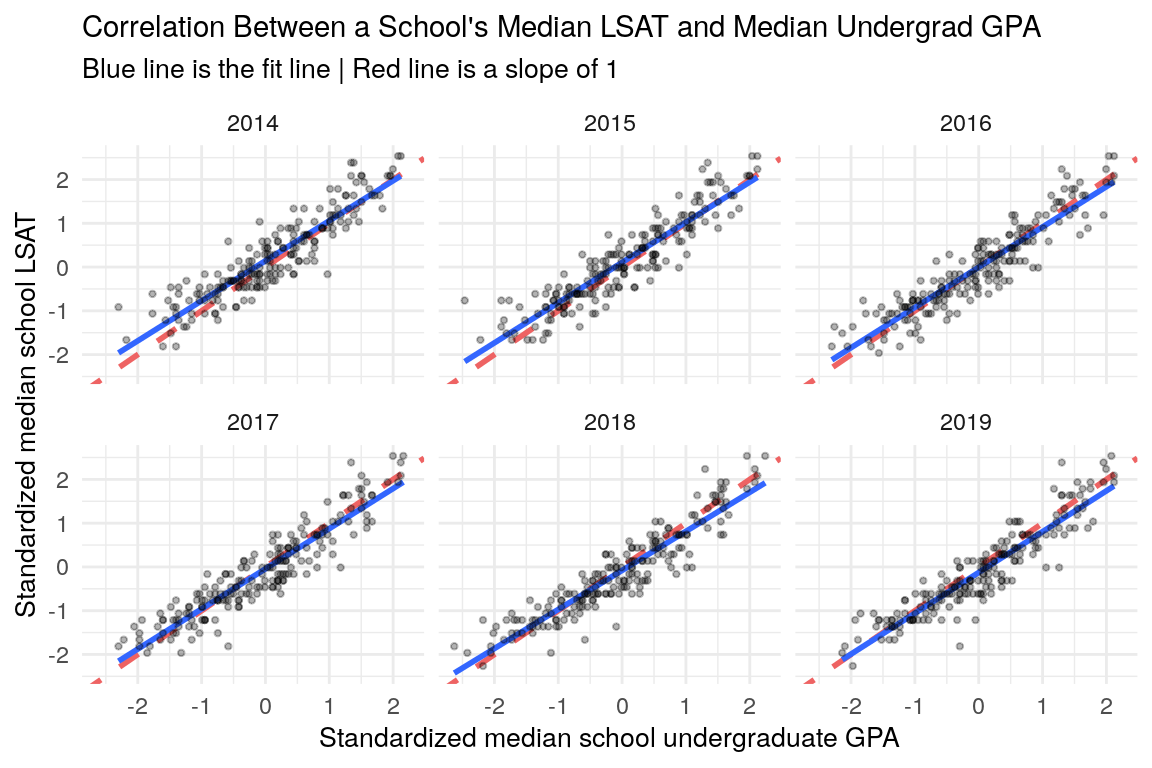
Figure 2: Correlation between each school’s standardized median LSAT and standardized median undergrad GPA. Blue line is the fit line of the data, red line is a hypothetical perfect fit line - a slope of 1. LSAT and GPA are highly correlated, with the actual fit line mirroring the perfect fit line.
Association between 1L attrition and both median LSAT and median undergrad GPA
Let’s also look at the association between first year (1L) attrition and both median undergrad GPA and median LSAT. Our expectation, based on prior knowledge, is that schools with lower median undergrad GPA and LSAT scores will also have higher attrition. Figure 3 confirms this prior. But, the relationship is not too strong.
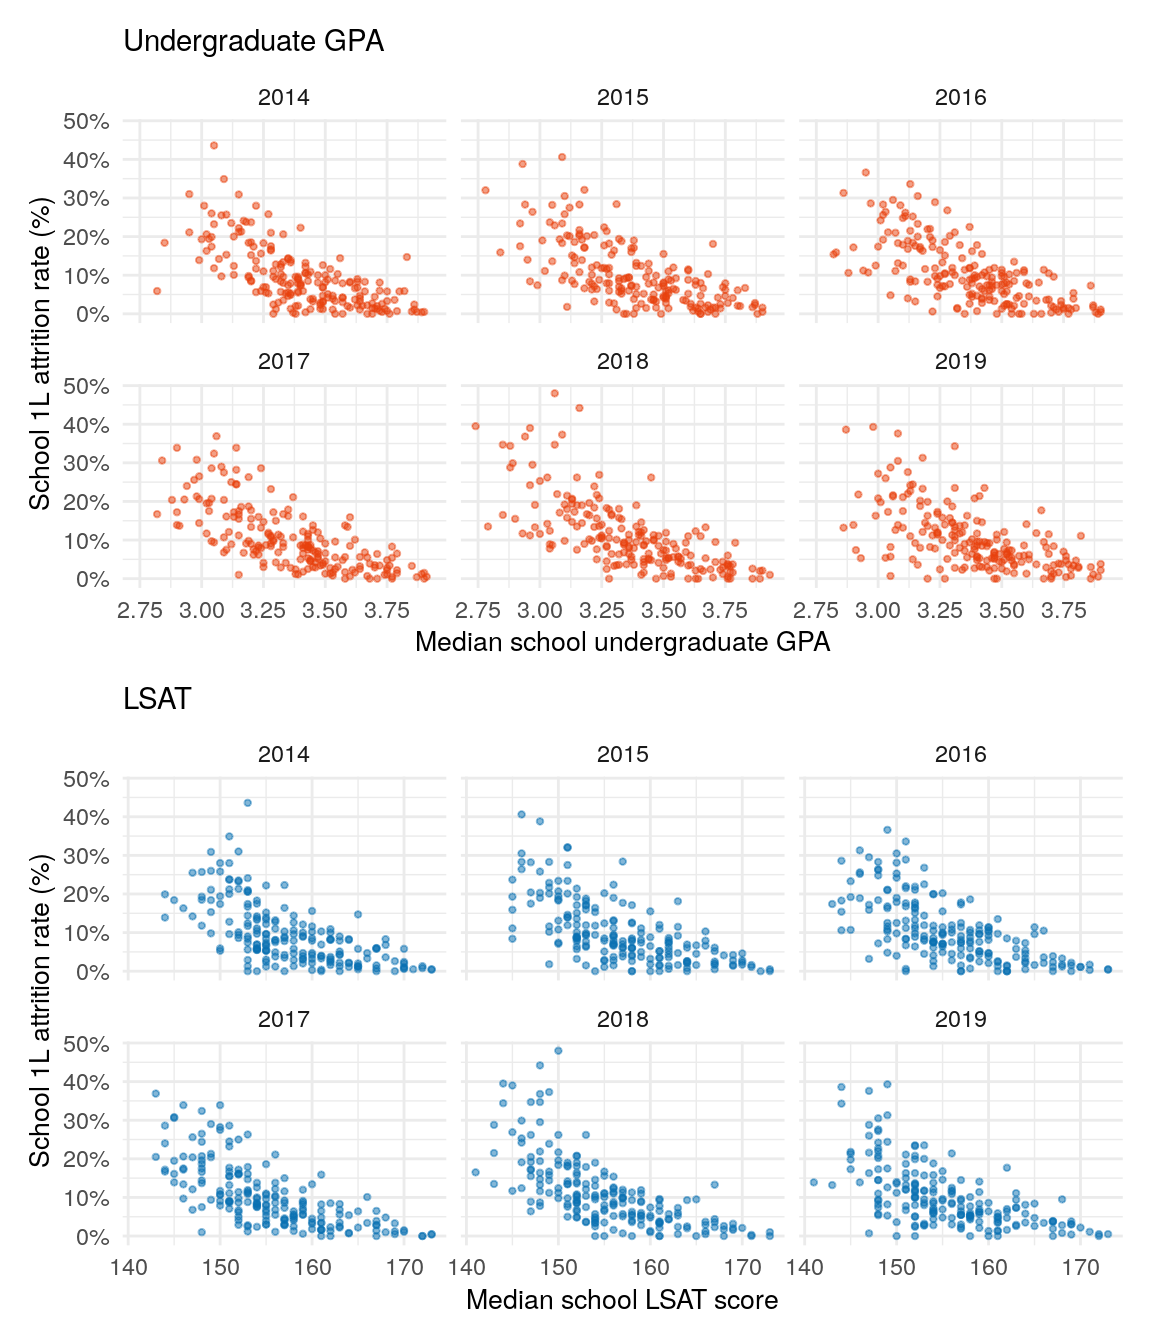
Figure 3: The top plot shows the relationship between a school’s median undergrad GPA and 1L attrition. The bottom plot shows the relationship between median LSAT and 1L attrition. Both median undergrad GPA and median LSAT correlate slightly with 1L attrition.
Association between 1L attrition and bar passage
Finally, figure 4 highlights the association between attrition and bar passage. Not surprisingly, it’s negative: schools with higher attrition rates have lower bar passage rates. This finding is not unexpected because we saw from figure 1 that higher median undergrad GPA and LSAT scores correlate with higher bar passage rates and figure 3 showed us that lower median undergrad GPA and LSAT scores are associated with higher attrition rates. Putting both findings together, we would assume that higher attrition rates correlate with lower bar passage rates.
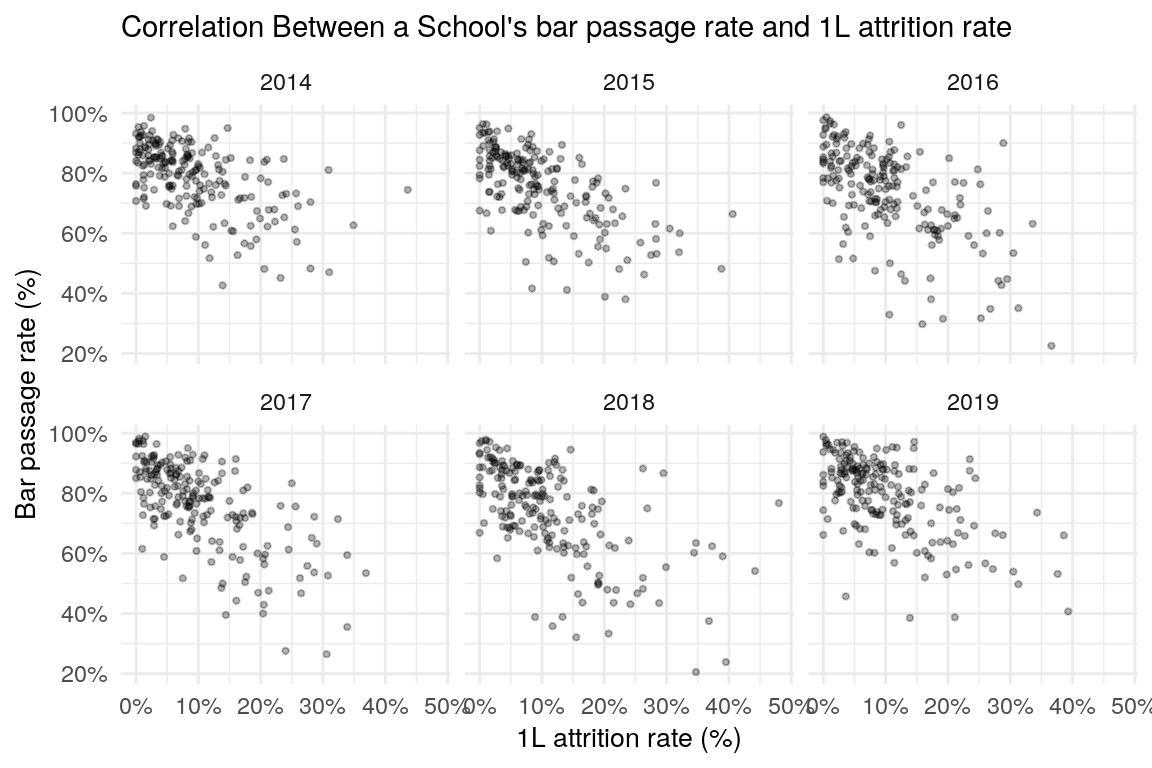
Figure 4: Correlation between bar passage rates and 1L attrition. There is a slight negative relationship, but there is also a lot of variance in the relationship.
Difference between predicted and actual bar passage
Models with admissions factors as predictors
We now turn to the heart of this post. We’ll predict each school’s bar passage rate and see how actual rates stack up against predictions. But, we need a good model to do this. We know our potential predictors: median, 25th percentile, and 75th percentile undergraduate GPA and LSAT score, and first year attrition. But, we don’t know the functional form of the model that provides the best predictions. Do we need all predictors or only a couple of them?
We will use two steps to search for the best model. First, we will conduct model comparison and validation on four different models that only include the undergrad GPA and LSAT predictors, along with year and state. Then, we will take this model and compare it against models with attrition as an additional predictor. Models will be compared by testing their predictions out of sample using leave-one-out cross validation (LOO). Posterior prediction checks will also be used to ensure the fit is reasonable.
All models are Bayesian hierarchical logistic regressions. The response is a school’s bar passage rate for a given state and year, with the model weighted by the number of takers. All models have the same group-level predictors: state and year. They only differ in their school-level predictors. The four initial models are below:
Linear: median undergraduate GPA and median LSAT score for the given graduating class year.
PCA: Figure 1 showed that median undergraduate GPA and median LSAT score are highly correlated, raising fears of colinearity. The 25th, median, and 75th percentiles of each metric are also highly correlated with themselves (the 25th percentile undergrad GPA is correlated with the median undergrad GPA). We’ll use Principal Component Analysis (PCA) to reduce the six highly correlated percentile variables into a smaller number of uncorrelated ones, while maintaining as much of the information in the variables as possible. The table below shows that the first two principal components contain 98% of the variance in the six LSAT and GPA variables. By only using these two principal components as predictors, we get 98% of the variance with only two uncorrelated variables.
| PC 1 | PC 2 | PC 3 | PC 4 | PC 5 | PC 6 | |
|---|---|---|---|---|---|---|
| Standard deviation | 2.24 | 0.42 | 0.22 | 0.14 | 0.11 | 0.07 |
| Proportion of Variance | 0.95 | 0.03 | 0.01 | 0.00 | 0.00 | 0.00 |
| Cumulative Proportion | 0.95 | 0.98 | 0.99 | 1.00 | 1.00 | 1.00 |
PCA spline: To account for possible non-linear relationships between the two PCA variables and bar passage, we’ll examine a model with splines added to the two PCA variables.
Spline: This model contains median undergraduate GPA and median LSAT score like model 1, but adds splines to them.
Compare admissions factors models using LOO
The table below compares each model by its expected log posterior density (ELPD). The Difference in ELPD column shows the difference in ELPD between the best fitting model - the model on the first row - and the model in the given row. The PCA spline model performs best. Plus, the standard error of the difference in ELPD between the best and second best model is small enough that we can have confidence that the PCA spline model did not perform best due to some randomness in the sampling draws. Assuming the model’s posterior predictive check pans out, we’ll start with it when adding attrition.
| Model | Difference in ELPD | Std. Error of Difference |
|---|---|---|
| PCA spline | 0 | 0 |
| PCA | -52 | 18 |
| Spline | -111 | 18 |
| Linear | -157 | 26 |
Poserior predictive checks of admissions factors models
Posterior predictive checks (PPC) simulate y values - bar passage rates - from the models. Our checks simulate 200 distributions of bar passage rates based on 200 model simulations. We can then compare these distributions to the actual distribution of rates. Ideally, they align.
Figure 5 shows the PPC plots. All models have the same problem: they overpredict at the 75% to 90% bar passage rates and underpredict at the tails. This is shown by the dark line (actual distribution) being lower than the light lines (simulated distributions) at the 75% to 90% range and higher than the light lines outside this point. The takeaway from the misfit models is that there will be too many predictions in the 75% to 90% range and not enough at each tail.
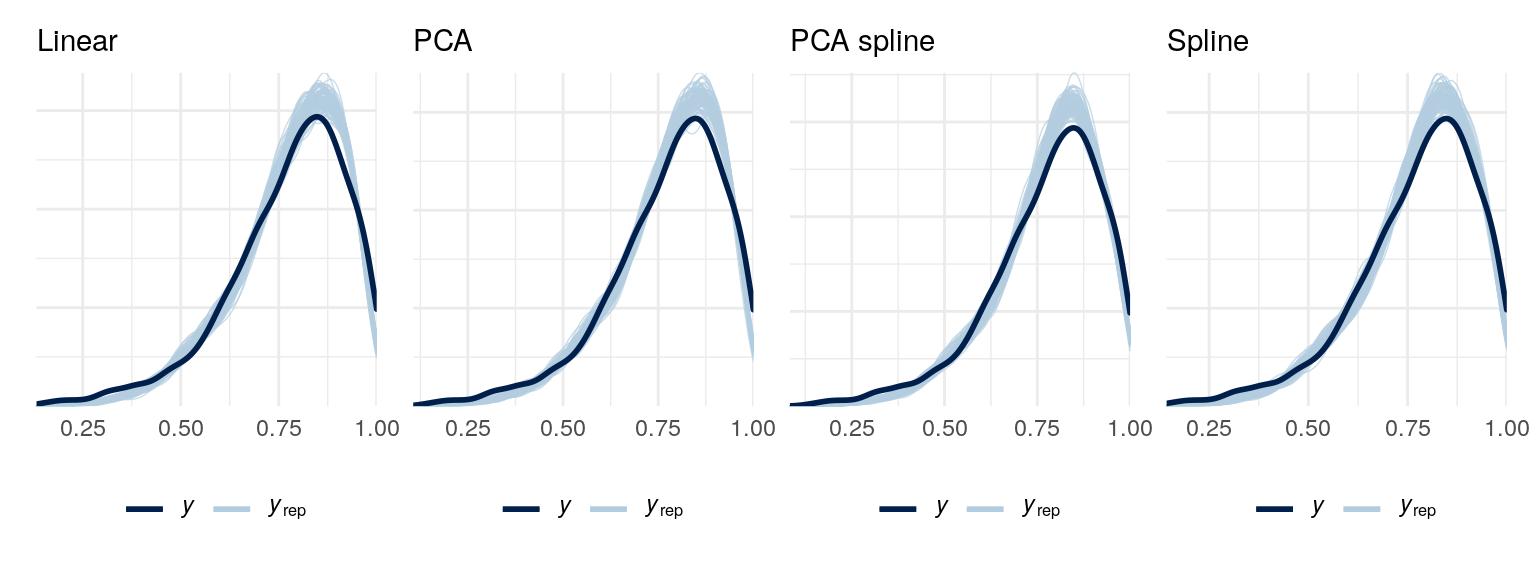
Figure 5: Posterior predictive check for all models. A problem in all models is that they fail to accurately predict at the most likely bar passage rates. We know this because at the highest points in the curve, the predicted passage rates for schools is higher than the actual rates.
Add attrition as a predictor
Step two involves using the best model in the previous section, PCA with a spline, and adding attrition as a predictor. We’ll incorporate attrition using the natural logarithm of attrition. The natural logarithm is used because attrition rates have a right skew: most schools have attrition rates between 0% and 15%, but some schools have rates greater than 30%. Using the natural logarithm removes much of the right skew and makes the distribution more symmetrical.
We’ll create two different models with attrition, each an extension of the PCA spline model. The first adds the natural logarithm of attrition, centered, as an individual predictor. The second also includes the natural logarithm of attrition, but wraps it in a spline to model non-linearity.
The table below compares each model based on the ELPD using leave-one-out cross validation. We see little difference between the two models with attrition added, but these two models are better than the model without attrition.
| Model | Difference in ELPD | Std. Error of Difference |
|---|---|---|
| PCA spline with attrition spline | 0 | 0 |
| PCA spline with attrition | -2 | 8 |
| PCA spline w/o attrition | -11 | 12 |
Moving on to the model check, the plot of posterior predictive checks in figure 6 shows that the models with attrition have the same problem we encountered in figure 5. More predicted pass rates fall between 70% and 90% than would be expected given the distribution of actual bar passage rates.
Despite the non-ideal fit, the PCA spline model with attrition will be used to predict bar passage rates of schools. This model performs almost identically to the PCA spline model with attrition added as a spline, but is simpler. All things equal, we’ll opt for the simpler.
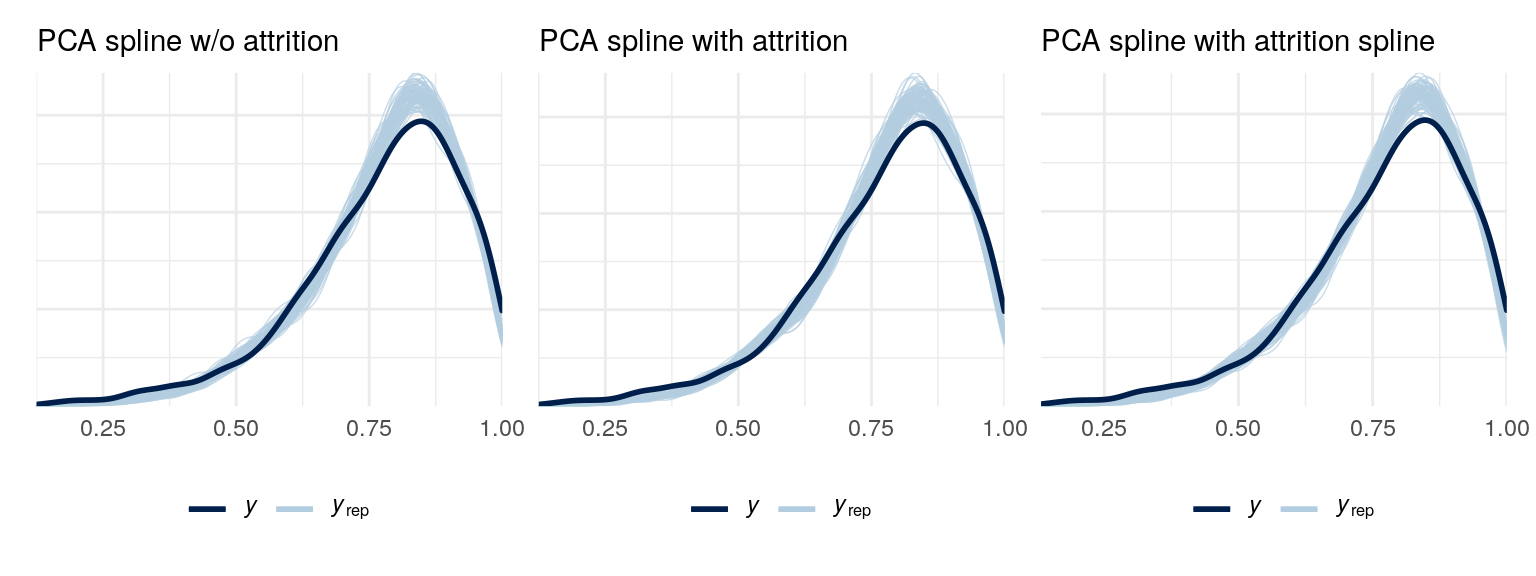
Figure 6: Posterior predictive checks. The attrition model cehcks reveal the same problem as the models without attrition - too many predictions in the 75% to 90% range.
Comparing actual and predicted bar passage rates for all US law schools
With technicalities behind use, let’s get to the results. Figure 7 compares each law school’s predicted and actual bar passage rates from 2014 to 2019. The left plot shows the 95% credible intervals for each school’s predicted bar passage rate (in red) and its actual rate (blue). The right plot, meanwhile, displays the 95% credible interval for each school’s residual. The residual is the actual rate minus the predicted rate. Finally, the percentages on the right represent the probability that the school’s actual rate is higher than its predicted rate. Stated differently, it’s the probability that the residual is positive.
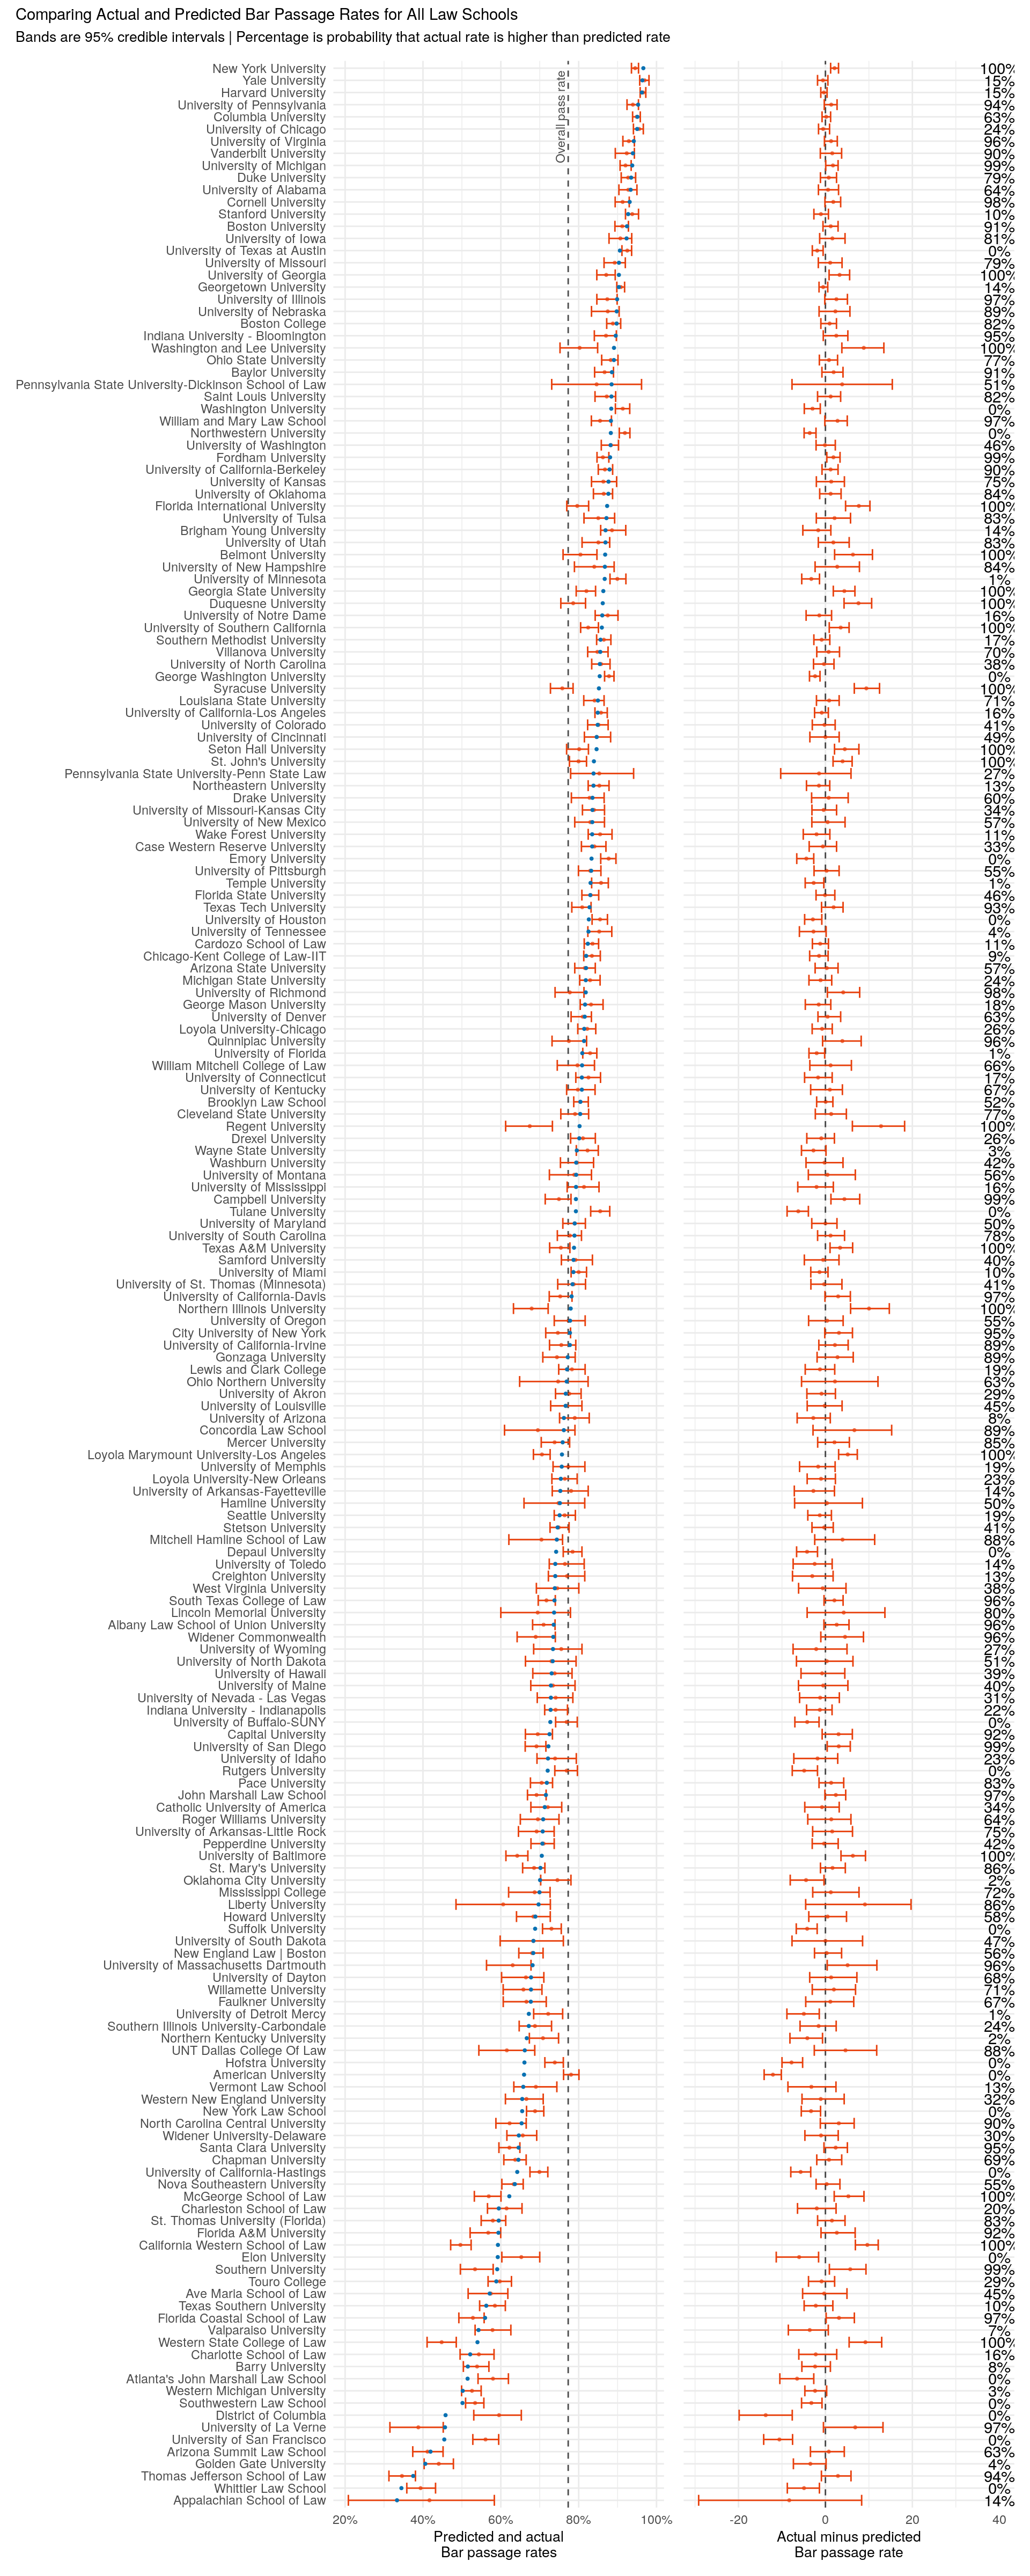
Figure 7: Left plot reveals actual (blue dot) and predicted (red dot) bar passage rates. Right plot shows residuals: actual minus predicted bar passage rates. The percentage on the right is the probability that the actual bar passage rate is higher than the predicted rate.
Three problems with the methodology
What do we make of the plots? For starters, simply ranking each school by its residual is ill-advised for three reasons.
- Schools have a lot of uncertainty in their residuals. A school’s ranking is it’s true residual plus uncertainty in the residuals; the dreaded error terms in models. The higher the uncertainty, the more that the ranking for specific schools will simply reflect randomness. Here, the uncertainty is large enough to where rankings will reflect more randomness than we are comfortable incorporating. Figure 7 illustrates this. It shows the University of Kentucky’s residual ranking among all 201 law schools based on 500 simulations of the model. The meidan simualted ranking is 84 and the 90% credible interval stretches from 28 to 148. This range is too wide to be helpful.
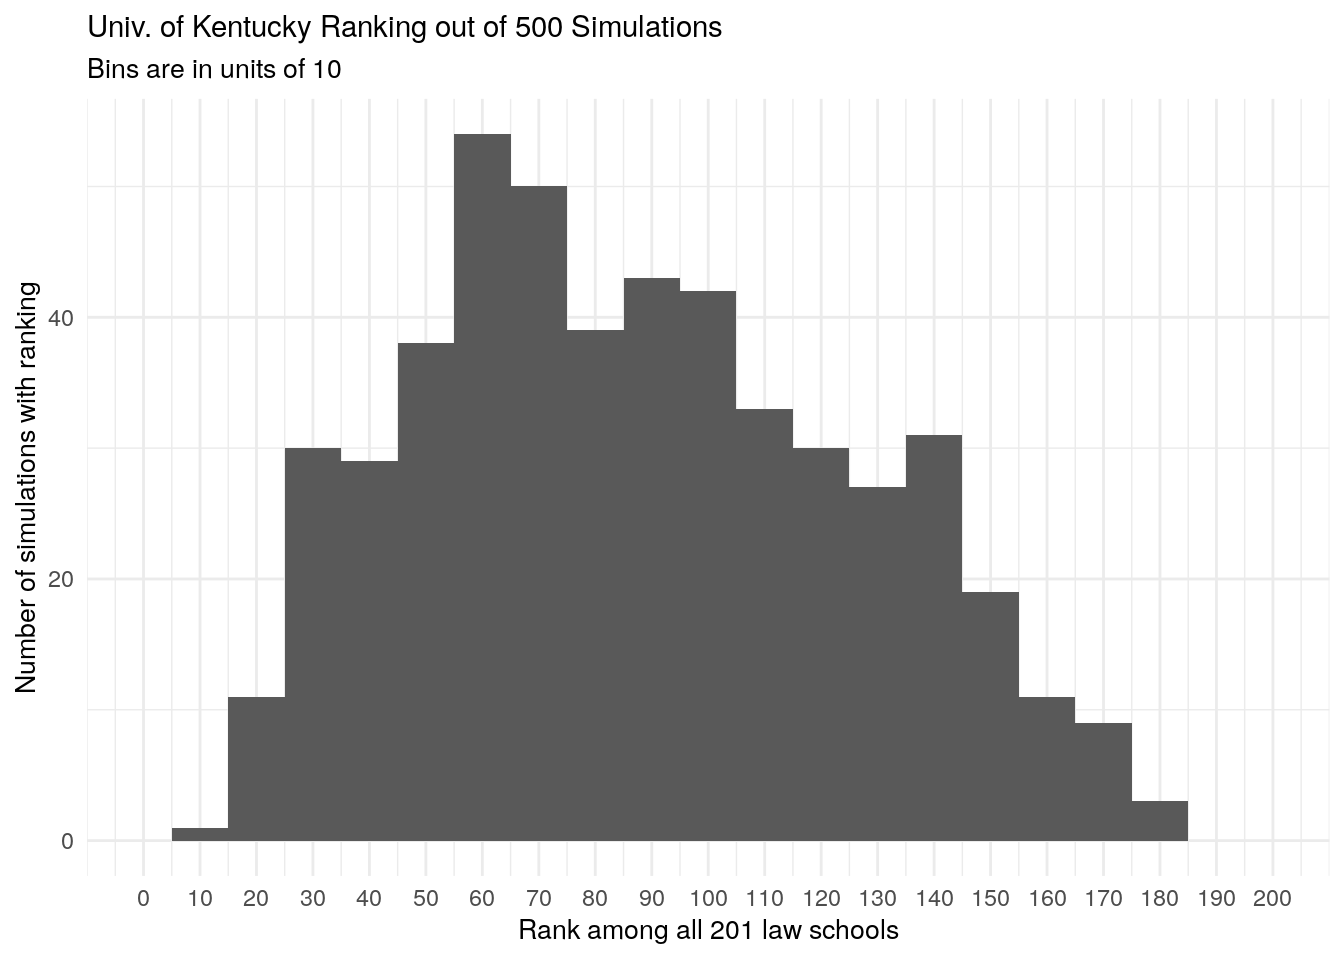
Figure 8: The University of Kentucky’s residual rankings from 500 model simulations. There is a wide degree of variance in the rankings, making them unhelpful.
Schools with high LSAT and undergrad GPAs will also have high predicted bar passage rates. Since neither actual nor predicted rates can exceed 100%, this leaves schools with high LSAT and undergrad GPAs little room to outperform their predictions. When you are already at the top, you can’t go much higher.
The predictions are only as good as the model. As figure 6 shows, the model is not ideal. It potentially misfits by different amounts depending on the predicted bar passage rate.
Comparing similair schools
Taking reasons two and three together, a better approach might be to compare similar schools. For example, with might compare schools with similar admissions factors and where the majority of bar takers are from the same state. To highlight this method, we’ll compare three North Carolina schools with similar admissions factors: Campbell University, Elon University, and North Carolina Central University.
Figure 9 shows the comparison’s results. It’s the difference between each school in their difference of residuals, only incorporating North Carolina bar exam results. To account for uncertainty, the entire probability distribution is shown for these differences.
Here’s how it works. Let’s say that Campbell’s actual NC bar passage rate is 70% and their predicted rate is 60%, for a difference of 10 percentage points. Elon’s actual NC rate and predicted rate are both 60%, for a difference of 0. In this situation, Campbell’s residual - difference between actual and predicted bar passage rate - is 10 percentage points higher than Elon’s (10 - 0).

Figure 9: Difference in residuals between comparitive law schools in North Carolina. Predictions and residuals are limited to the NC bar exam.
OK, so this might be useful. But, I’m still not comfortable with it due to the problems previously mentioned. The best course of action is to scrap the whole enterprise. But, in the spirit of learning from what goes wrong, I figured I would post it here for posterity.
Addendum: the final rankings that have little value
If you ignored this post’s advice and want to know the actual modeled ranking, here you go. Again, you shouldn’t make much of them; I’m not. And you especially shouldn’t make much of them once you see the wide 90% credible intervals. Also, going back to problem two mentioned above, notice that almost all of the top ranking schools have low LSAT / GPA combinations and low bar passage rates.
| Rank | 90% Credible Interval | ||
|---|---|---|---|
| Lower bound | Upper bound | ||
| Regent University | 1 | 1 | 7 |
| Northern Illinois University | 2 | 1 | 11 |
| California Western School of Law | 3 | 1 | 10 |
| Syracuse University | 3 | 1 | 11 |
| Western State College of Law | 3 | 1 | 13 |
| Washington and Lee University | 6 | 1 | 19 |
| Liberty University | 7 | 1 | 108 |
| Duquesne University | 8 | 3 | 20 |
| Florida International University | 8 | 3 | 19 |
| University of La Verne | 10 | 1 | 46 |
| Belmont University | 11 | 2 | 35 |
| Concordia Law School | 11 | 1 | 105 |
| University of Baltimore | 11 | 7 | 29 |
| Southern University | 14 | 4 | 47 |
| McGeorge School of Law | 15 | 6 | 43 |
| University of Massachusetts Dartmouth | 16 | 1 | 77 |
| Loyola Marymount University-Los Angeles | 17 | 10 | 36 |
| UNT Dallas College Of Law | 18 | 1 | 110 |
| Lincoln Memorial University | 19 | 1 | 149 |
| Seton Hall University | 20 | 8 | 48 |
| Widener Commonwealth | 20 | 3 | 79 |
| Campbell University | 22 | 5 | 56 |
| Georgia State University | 22 | 10 | 49 |
| Mitchell Hamline School of Law | 24 | 1 | 111 |
| Quinnipiac University | 25 | 5 | 79 |
| St. John's University | 25 | 13 | 51 |
| University of Richmond | 25 | 8 | 72 |
| University of Southern California | 28 | 13 | 63 |
| Texas A&M University | 29 | 15 | 70 |
| Pennsylvania State University-Dickinson School of Law | 30 | 1 | 194 |
| University of Georgia | 30 | 17 | 69 |
| City University of New York | 32 | 11 | 88 |
| Florida Coastal School of Law | 32 | 13 | 82 |
| University of San Diego | 34 | 14 | 74 |
| North Carolina Central University | 35 | 10 | 105 |
| Capital University | 36 | 12 | 98 |
| University of California-Davis | 37 | 17 | 89 |
| Thomas Jefferson School of Law | 38 | 11 | 94 |
| Gonzaga University | 39 | 8 | 110 |
| William and Mary Law School | 39 | 17 | 83 |
| Albany Law School of Union University | 41 | 18 | 93 |
| Florida A&M University | 41 | 11 | 104 |
| Indiana University - Bloomington | 41 | 14 | 92 |
| University of New Hampshire | 41 | 5 | 124 |
| University of Illinois | 45 | 16 | 86 |
| John Marshall Law School | 46 | 24 | 93 |
| Santa Clara University | 47 | 19 | 97 |
| University of Nebraska | 48 | 16 | 110 |
| University of California-Irvine | 49 | 13 | 109 |
| New York University | 50 | 44 | 75 |
| Ohio Northern University | 51 | 1 | 168 |
| South Texas College of Law | 52 | 32 | 99 |
| University of Tulsa | 52 | 12 | 123 |
| Mercer University | 54 | 15 | 117 |
| Cornell University | 55 | 33 | 95 |
| Willamette University | 55 | 12 | 144 |
| Texas Tech University | 57 | 28 | 104 |
| Baylor University | 58 | 26 | 108 |
| Fordham University | 58 | 37 | 90 |
| University of Utah | 58 | 12 | 118 |
| University of Arkansas-Little Rock | 61 | 13 | 143 |
| St. Mary's University | 62 | 23 | 113 |
| University of Michigan | 62 | 38 | 89 |
| Vanderbilt University | 64 | 29 | 109 |
| St. Thomas University (Florida) | 65 | 18 | 122 |
| University of Iowa | 65 | 22 | 120 |
| University of Dayton | 67 | 12 | 158 |
| Cleveland State University | 68 | 22 | 133 |
| Mississippi College | 68 | 8 | 148 |
| University of Pennsylvania | 68 | 46 | 103 |
| Pace University | 71 | 32 | 129 |
| Roger Williams University | 72 | 14 | 156 |
| Boston University | 73 | 45 | 110 |
| University of Kansas | 73 | 23 | 131 |
| University of Virginia | 73 | 47 | 103 |
| William Mitchell College of Law | 73 | 17 | 164 |
| Faulkner University | 77 | 9 | 156 |
| University of California-Berkeley | 77 | 46 | 109 |
| Saint Louis University | 79 | 30 | 120 |
| University of Missouri | 79 | 29 | 126 |
| University of South Carolina | 79 | 23 | 130 |
| University of Oklahoma | 82 | 37 | 123 |
| University of Kentucky | 83 | 28 | 148 |
| Boston College | 84 | 51 | 122 |
| Louisiana State University | 85 | 34 | 132 |
| Chapman University | 86 | 34 | 137 |
| Ohio State University | 87 | 48 | 127 |
| Villanova University | 87 | 40 | 137 |
| Arizona Summit Law School | 89 | 26 | 155 |
| Drake University | 89 | 18 | 151 |
| Duke University | 89 | 52 | 120 |
| University of Alabama | 92 | 46 | 138 |
| University of Montana | 93 | 15 | 170 |
| Howard University | 94 | 20 | 160 |
| University of Denver | 95 | 41 | 139 |
| University of New Mexico | 96 | 20 | 148 |
| University of Oregon | 97 | 36 | 168 |
| University of North Dakota | 98 | 17 | 184 |
| Hamline University | 99 | 16 | 193 |
| New England Law | Boston | 99 | 35 | 147 |
| University of Pittsburgh | 99 | 42 | 152 |
| Arizona State University | 102 | 48 | 146 |
| Nova Southeastern University | 103 | 52 | 151 |
| Columbia University | 104 | 83 | 124 |
| University of Cincinnati | 105 | 52 | 163 |
| Brooklyn Law School | 106 | 65 | 139 |
| University of Maryland | 107 | 56 | 155 |
| University of Washington | 108 | 66 | 153 |
| University of South Dakota | 109 | 17 | 195 |
| Florida State University | 110 | 69 | 154 |
| University of Louisville | 111 | 40 | 175 |
| Stetson University | 112 | 75 | 165 |
| University of Colorado | 112 | 61 | 161 |
| Ave Maria School of Law | 114 | 30 | 184 |
| Pepperdine University | 115 | 52 | 162 |
| University of St. Thomas (Minnesota) | 115 | 46 | 168 |
| Washburn University | 115 | 35 | 173 |
| University of North Carolina | 118 | 73 | 161 |
| Harvard University | 119 | 98 | 130 |
| University of Missouri-Kansas City | 120 | 58 | 162 |
| University of Chicago | 121 | 88 | 141 |
| Yale University | 122 | 98 | 144 |
| Georgetown University | 123 | 100 | 142 |
| Samford University | 123 | 55 | 182 |
| University of Maine | 125 | 32 | 191 |
| West Virginia University | 126 | 38 | 194 |
| Case Western Reserve University | 127 | 60 | 170 |
| University of Hawaii | 128 | 39 | 189 |
| Catholic University of America | 129 | 57 | 186 |
| Loyola University-Chicago | 129 | 78 | 163 |
| University of California-Los Angeles | 131 | 94 | 152 |
| Touro College | 132 | 73 | 177 |
| Southern Methodist University | 133 | 90 | 161 |
| University of Akron | 134 | 68 | 177 |
| Drexel University | 135 | 74 | 180 |
| Western New England University | 135 | 48 | 191 |
| Loyola University-New Orleans | 137 | 74 | 179 |
| Michigan State University | 137 | 86 | 174 |
| Stanford University | 137 | 101 | 160 |
| Widener University-Delaware | 137 | 66 | 187 |
| University of Nevada - Las Vegas | 141 | 55 | 190 |
| Cardozo School of Law | 142 | 96 | 160 |
| Seattle University | 143 | 82 | 175 |
| Lewis and Clark College | 144 | 87 | 188 |
| Indiana University - Indianapolis | 145 | 78 | 175 |
| University of Miami | 146 | 100 | 170 |
| University of Notre Dame | 147 | 88 | 182 |
| Chicago-Kent College of Law-IIT | 148 | 96 | 169 |
| Northeastern University | 149 | 91 | 175 |
| George Mason University | 150 | 88 | 182 |
| University of Connecticut | 151 | 83 | 183 |
| Southern Illinois University-Carbondale | 152 | 77 | 195 |
| University of Memphis | 153 | 77 | 192 |
| University of Idaho | 154 | 69 | 195 |
| Brigham Young University | 155 | 97 | 186 |
| Pennsylvania State University-Penn State Law | 155 | 34 | 198 |
| University of Texas at Austin | 157 | 126 | 166 |
| Charleston School of Law | 158 | 80 | 197 |
| University of Florida | 159 | 122 | 175 |
| University of Wyoming | 159 | 51 | 198 |
| Wake Forest University | 159 | 102 | 191 |
| University of Mississippi | 162 | 87 | 192 |
| Texas Southern University | 163 | 100 | 191 |
| Charlotte School of Law | 164 | 80 | 196 |
| Barry University | 165 | 110 | 193 |
| George Washington University | 165 | 139 | 174 |
| Western Michigan University | 165 | 117 | 184 |
| University of Toledo | 168 | 96 | 197 |
| Temple University | 169 | 130 | 184 |
| University of Tennessee | 169 | 121 | 193 |
| University of Arkansas-Fayetteville | 171 | 92 | 197 |
| Wayne State University | 171 | 131 | 193 |
| Creighton University | 173 | 96 | 198 |
| University of Arizona | 173 | 115 | 195 |
| University of Houston | 175 | 138 | 185 |
| Washington University | 176 | 144 | 185 |
| Southwestern Law School | 177 | 142 | 192 |
| University of Minnesota | 177 | 145 | 188 |
| Vermont Law School | 177 | 95 | 199 |
| New York Law School | 180 | 147 | 190 |
| Golden Gate University | 181 | 122 | 195 |
| Northwestern University | 182 | 159 | 188 |
| Valparaiso University | 183 | 121 | 198 |
| Depaul University | 184 | 160 | 194 |
| University of Buffalo-SUNY | 184 | 155 | 195 |
| Northern Kentucky University | 186 | 148 | 199 |
| Suffolk University | 186 | 159 | 193 |
| Emory University | 188 | 166 | 193 |
| Oklahoma City University | 189 | 145 | 198 |
| University of Detroit Mercy | 190 | 157 | 198 |
| Rutgers University | 191 | 164 | 198 |
| Whittier Law School | 191 | 157 | 198 |
| University of California-Hastings | 193 | 179 | 197 |
| Elon University | 194 | 167 | 200 |
| Atlanta's John Marshall Law School | 195 | 176 | 199 |
| Tulane University | 195 | 182 | 197 |
| Hofstra University | 197 | 190 | 198 |
| Appalachian School of Law | 198 | 30 | 201 |
| University of San Francisco | 199 | 197 | 201 |
| American University | 200 | 199 | 201 |
| District of Columbia | 200 | 198 | 201 |
Shane Orr
Education Analyst
Spent six years playing Army, another three as a lawyer, and finally settled into being a data and programming guy.